Day 4
Unlocking potentials
Story by Teri Pecoskie

Teri Pecoskie is an award-winning multimedia journalist and The Spectator's education reporter. She also co-authored the landmark BORN: A Code Red Project series, which was awarded the country's highest investigative journalism honour in 2012.
Teri has covered issues related to school achievement since she started at The Spectator in 2010.
Photographs by John Rennison
Web design by Pete Smaluck
Published April 16, 2014.
Interactive map: Find your school's scores
At a glance, the EQAO results at Adelaide Hoodless are unremarkable.
In any given year, about half the kids at the old Maplewood Avenue school pass the province’s tests in reading — well below the Ontario average.
Ditto for writing, and even fewer in math.
But if you look at the numbers a little more closely, you’ll see a pattern that is remarkable:
Scores at Adelaide Hoodless are on a steep upward slope.
Since 2008, the school improved its average pass rate on EQAO tests by more than 60 per cent — and it did so in the face of some known disadvantages, such as a high proportion of low-income kids.
It’s not a one-off.
The Spectator’s analysis of six years of standardized test data for more than 140 local elementary schools reveals a number of anomalies — schools that, for better or worse, stand out.
Like Adelaide Hoodless, some are noteworthy because their outcomes have dramatically improved. Others, such as Our Lady of the Assumption, are exceptional because they score better than experts would predict given their unique demographics.
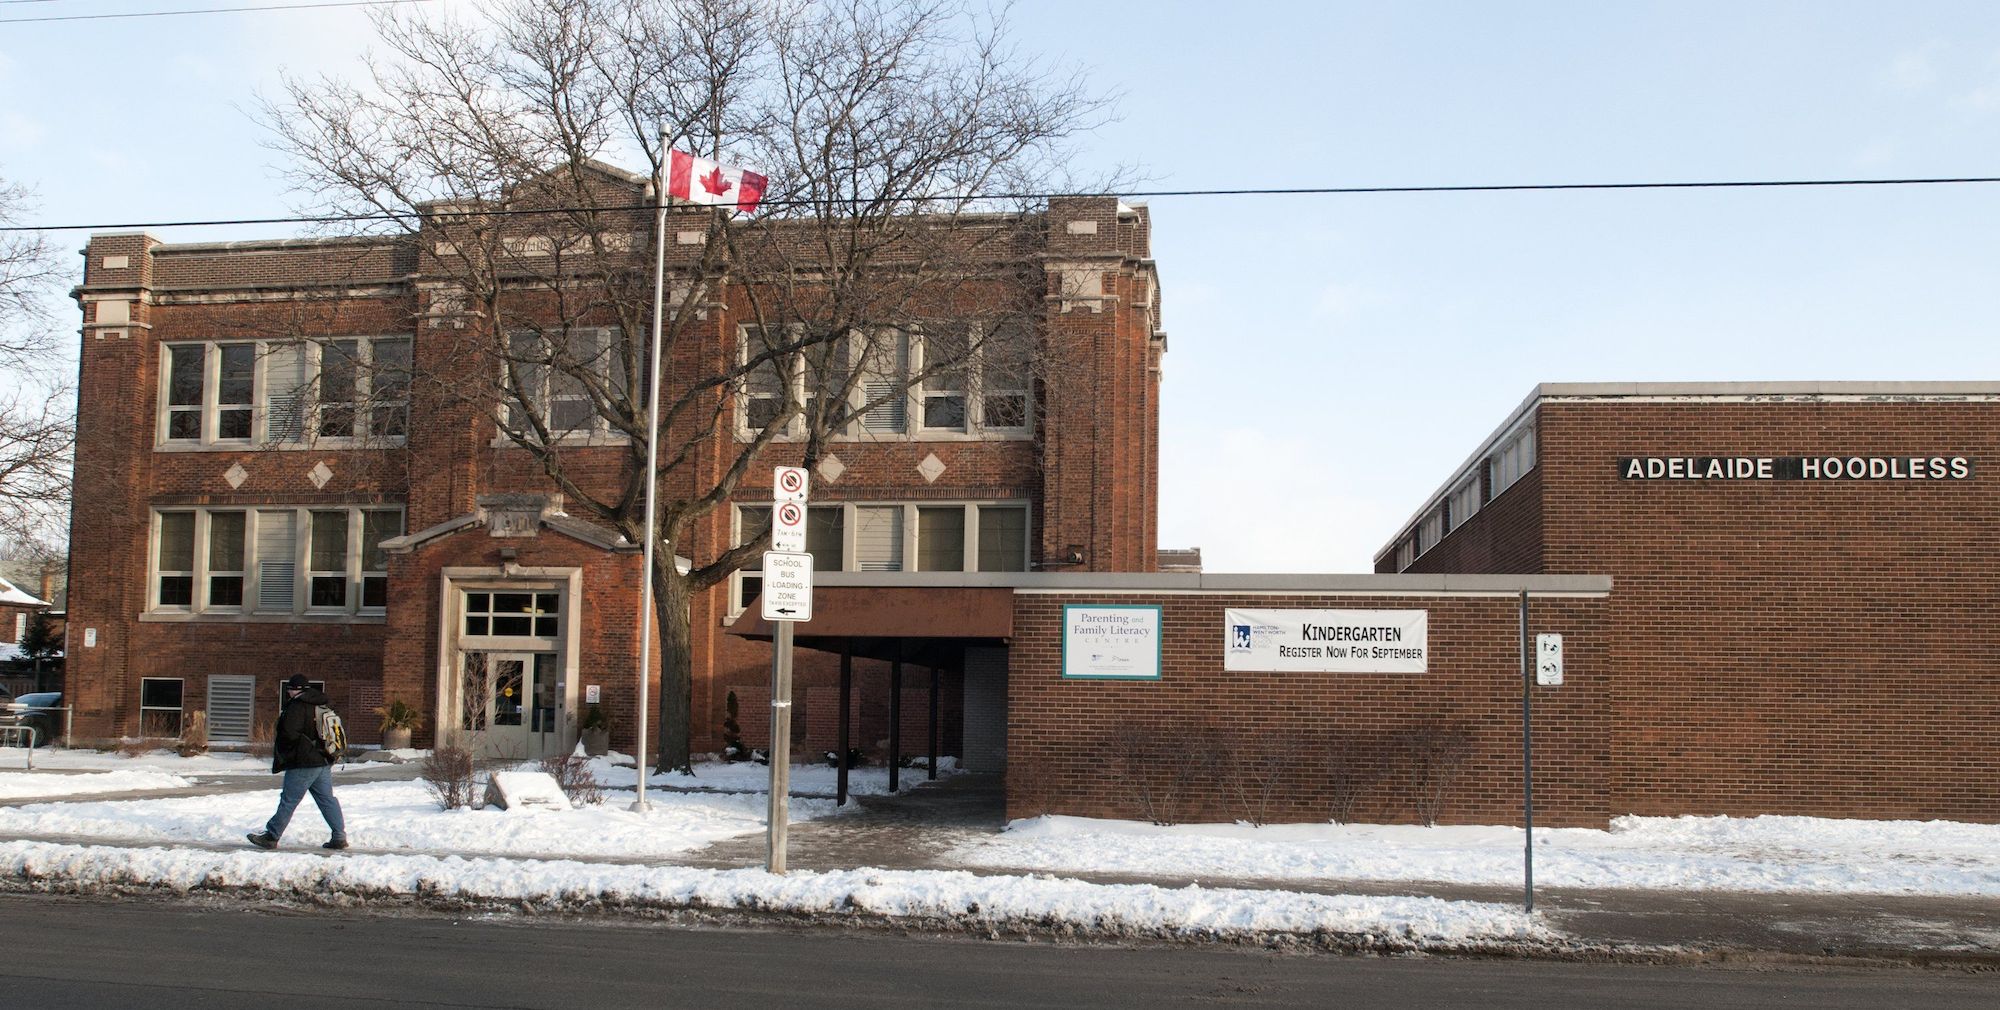
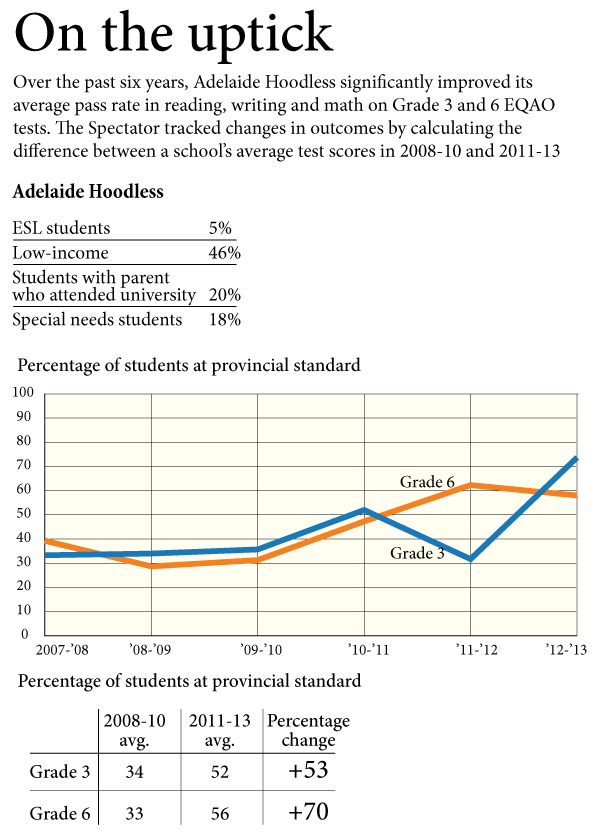
Adelaide Hoodless Elementary School
“The argument is, those are interesting schools,” says David Johnson, an economics professor at Wilfrid Laurier University. “We ought to go and find out why that’s happening.”
It appears there’s no single explanation.
In interviews with parents, educators and stakeholders, The Spectator found there’s often a complex web of interventions at work in Hamilton’s standout schools. And everything from high expectations to a positive schools culture can also play a role.
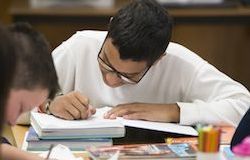
Kelly Charles had her work cut out for her.
When the principal arrived at Adelaide Hoodless six years ago, outcomes at the school were bleak.
One in three kids was passing the province’s Grade 3 reading test, and in writing, just slightly more. Only one in four was meeting the standard in math.
In Grade 6, fewer than half were reading and writing at grade level. In math, it was around 20 per cent.
“When I got here, I was kind of standing on my soapbox to say there’s absolutely no reason whatsoever why these children cannot learn and do really well,” Charles says. “That was the message that I brought with me, and that is the message I’m hammering home every day.”
The school isn’t there yet, she adds — “not by any stretch.” It still needs to reach boys a bit better, as well as its students with special needs.
But it’s on its way.
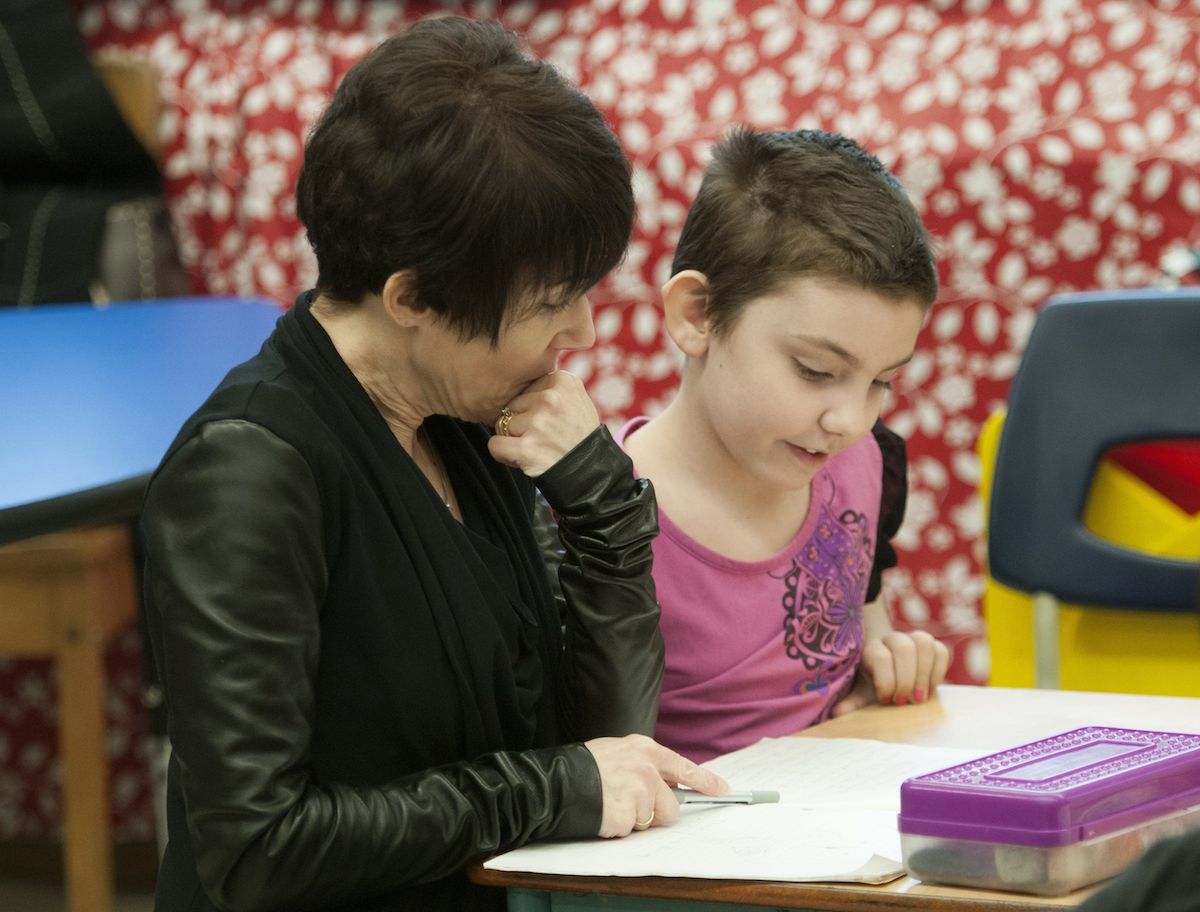
Adelaide Hoodless principal Kelly Charles, seen working with Grade 3 student Trinity Miller, believes there's 'no reason whatsoever' why her students can't learn and excel.
Since 2008, Adelaide Hoodless has boosted its average pass rate by 53 per cent on the Grade 3 test. In Grade 6, outcomes are 70 per cent better.
Importantly, there are also signs of improvements as kids move from the Grade 3 to Grade 6 test. For instance, the pass rate for one cohort jumped 47 per cent in reading, 21 per cent in writing and a whopping 181 per cent in math between the 2010 and 2013 tests.
A lot of hard work went into the gains. The school had to teach kids how to take a test, for one — a skill necessary for academic success at any level.
It also implemented literacy and numeracy interventions, such as a peer reading program and after-school supports, and moved teachers around until they landed in the class that best suited their teaching style and skills.
“It’s taken a while to get people where they feel comfortable and where they can really shine,” Charles admits.
What’s made the biggest difference, however, has been a shift in the attitudes and expectations of students, parents and staff.
“I think that mindset was the first thing that had to happen, and that takes a long time to change,” the principal says. “Telling the kids that they’re better than some of the behaviours they’re showing and they’re worth it.”
If the kids don’t think they can do better, it makes everybody’s job difficult, she adds. “The kids have to believe it.”
In the past six years, Eastmount Park, a small, yellow brick school on the central Mountain, raised its average pass rate in reading by 52 per cent — more than any other school in the city. For writing, it was W.H. Ballard in east Hamilton, which saw a 51 per cent boost.
In math, a subject in which pass rates have been sliding in local boards and across Ontario, Adelaide Hoodless improved its average score by 150 per cent.
These three schools bettered their academic outcomes despite having more low-income and special needs students than the provincial average. And although it might not be immediately apparent, these three schools stand out.
AUDIO: Adelaide Hoodless teachers Sarah Kondo and Shannon Brown discuss using EQAO data to boost student achievement
Grade 2 was tough for Orion Mack.
“He had a bad fit with his teacher,” says his dad, Neil. “He was struggling. She spent the entire year telling us we needed to medicate our son.”
Then the family left Toronto for Hamilton. They bought an old home in the St. Clair neighbourhood, and Orion starting going to the local school, Adelaide Hoodless.
That’s where things turned around.
Last year, Orion excelled on the Grade 3 EQAO assessment. In his dad’s words, he went from being “a failing, remedial student” to “a success story.”
Neil says there’s no single reason why his son is doing better. In his view, school programs, a variety of extracurricular activities, and the tight-knit community all played a role, as did motivated teachers and an engaged principal who was committed to bringing the school up.
“I think it’s just a case where a lot of things are coming together to make it better,” he says.

Neil Mack, parent, Adelaide Hoodless
Improvements aren’t the only way to identify academic outliers.
Just ask David Johnson, the Laurier prof.
In his work for the C.D. Howe Institute, a Toronto-based think-tank, Johnson has analyzed school test scores in Ontario, Alberta and B.C. But instead of looking only at pass rates or top marks, he focuses on how schools perform relative to one another when the unique characteristics of their communities are factored into the equation.
“We want to compare schools that are comparable,” he says. “It’s simply not interesting to compare a school in the best district of Ancaster to the school down near Hamilton General Hospital.”
Take St. Martin of Tours. In a 2012 report, Johnson and co-author Robbie Brydon found the Stoney Creek school had better outcomes than at least 99 per cent of schools with similar demographics. In Johnson’s view, it’s an indication that good practices are at work.
G.L. Armstrong, by contrast, had worse outcomes than almost all other comparable schools — a sign, according to Johnson’s report, that there could be room for improvement.
Ups and downs
Here’s a look at the schools with the greatest improvements in their average EQAO scores over the past six years, as well as those with the greatest declines:
Up: Adelaide Hoodless, W.H. Ballard, Chedoke, St. Teresa of Avila, Eastmount Park, St. Eugene, St. Patrick, Fessenden, St. Joseph and R.L. Hyslop
Down: Holy Name of Jesus, Sir Wilfrid Laurier, St. Therese of Lisieux, Lawfield, St. Marguerite d’Youville, Blessed Sacrament, Green Acres, Lincoln Alexander, Blessed Teresa of Calcutta and Tapleytown
The Spectator asked David Rusk, a Washington-based urban consultant, to weigh in on Hamilton’s EQAO results.
Like Johnson, he used a statistical method that factors income, special education rates and other demographic variables, such as lone-parent rates and parent education, into the mix in order to look at how well students fared on the Grade 6 assessments over the past three years.
What Rusk found was that most schools in Hamilton are doing about as well as predicted, while about 16 per cent, including Queen’s Rangers and C.B. Stirling, are faring worse.
Around 15 per cent of schools, including Our Lady of the Assumption, Norwood Park and St. Lawrence, are scoring higher than predicted, all things considered.
There are obstacles facing some of the families at St. Lawrence.
Poverty is one, language barriers another. There’s also an elevated chance that any given child will drop out.
“We’re in a neighbourhood where socio-economically and demographically there are challenges,” says Mike Goffredo, the school principal. “So there are a lot of things we have in place here to help our kids.”
He reels off the interventions.
There are after-school programs, a breakfast club, art classes and sports. There are specialized teachers and tutors, and the school’s Catholic faith.
“If you put all those things together, I think it explains why we’re doing well,” Goffredo says.
And it is, all factors considered, despite the school’s ostensibly low average scores — that is, a 72 per cent pass rate in writing and around 60 per cent in reading and math.
Consider Rusk’s analysis, which shows St. Lawrence scored 38 per cent higher than predicted on the province’s Grade 6 tests. Or Johnson’s research, which put the school in the 77th and 94th percentile when it comes to Grade 3 and 6 tests, respectively.
“We have the social, we do the academics, but the big umbrella is our faith,” Goffredo says. “We accept everybody, we treat them with respect and that makes a difference.”
Over- and under-performers
David Rusk, a Washington-based urban strategist, performed a linear regression analysis on The Spectator’s data to determine which schools are doing better and worse than predicted on the province’s Grade 6 EQAO tests, when income and other demographic variables are factored in. Here’s a look at who’s doing better or worse than expected.
Much better than predicted: Our Lady of the Assumption, Norwood Park, Dr. John Seaton and Eastmount Park
Better than predicted: St. Lawrence, St. Martin of Tours, Mount Hope, Regina Mundi, Blessed Kateri Tekakwitha, Queen Victoria, Mountview, Janet Lee, Spencer Valley, Allan A. Greenleaf, St. Ann (Hamilton), Buchanan Park, R.A. Riddell and Corpus Christi
Worse than predicted: Memorial (Hamilton), Mount Albion, Blessed John Paul II, Our Lady of Lourdes, Templemead, Lisgar, G.L. Armstrong, Lawfield, Our Lady of Mount Carmel, Canadian Martyrs, Viscount Montgomery, Blessed Teresa of Calcutta, Huntington Park, Hess Street, Holy Name of Jesus, Cardinal Heights and Dalewood
Much worse than predicted: Queen’s Rangers and Cecil B. Stirling
VIDEO: Inside St. Lawrence's successful after-school basketball program
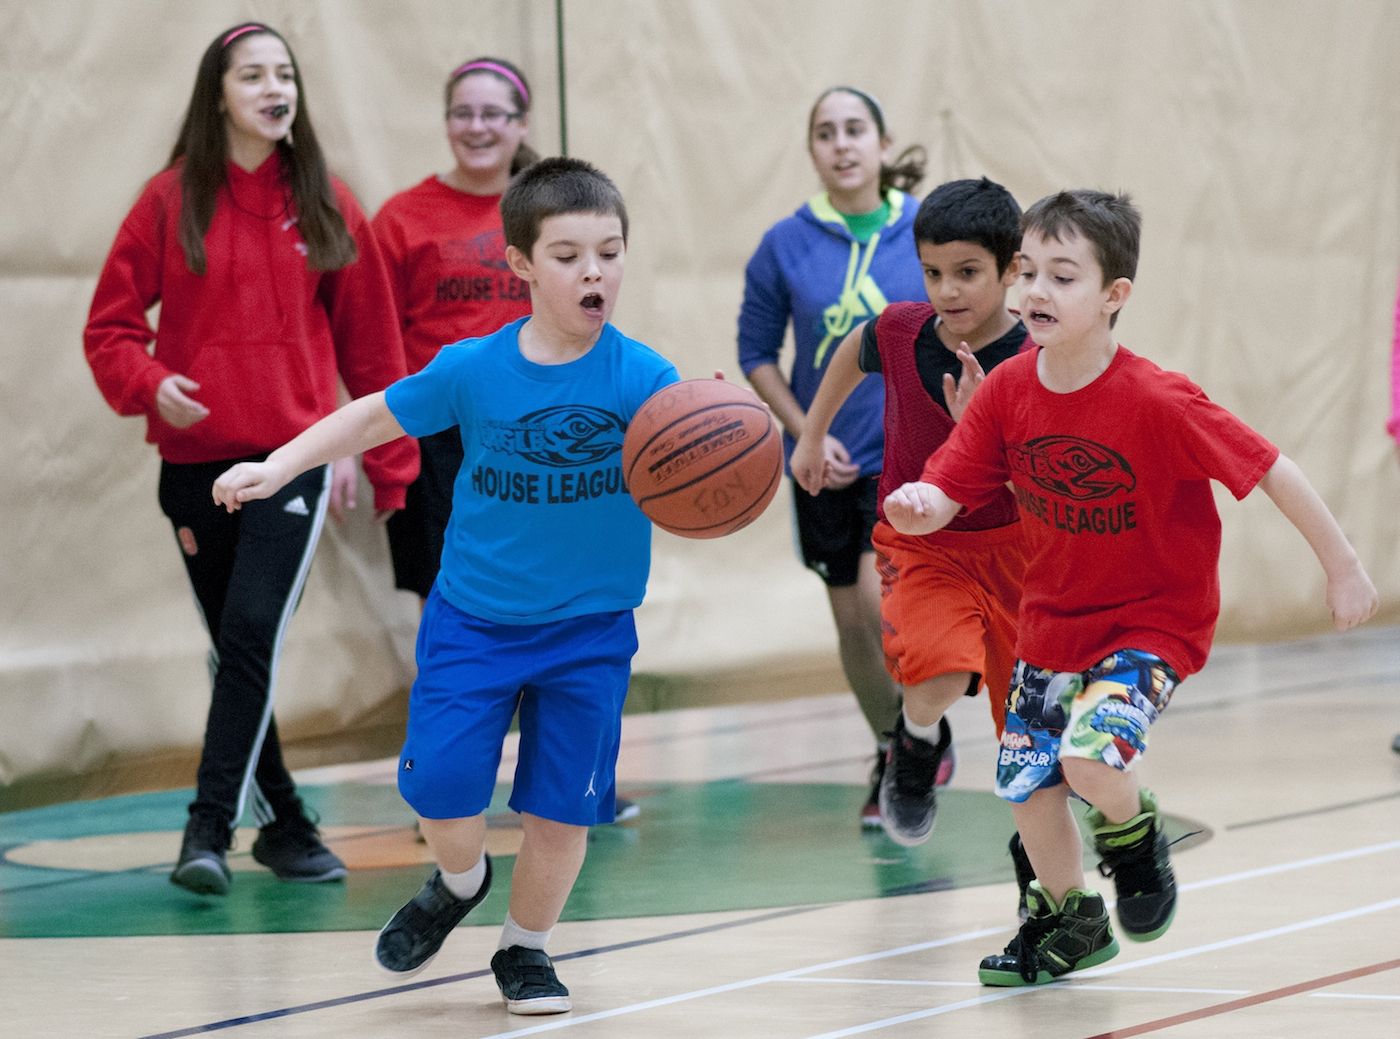
Zayne Kras Milligan, left, and Zachary Brosseau go after the ball in a St. Lawrence house league game. After-school sports, a breakfast club and art classes are among the programs at St. Lawrence designed to keep kids engaged and help them succeed.
St. Lawrence, Adelaide Hoodless and the other outlying schools offer concrete proof that academic and social interventions can change academic outcomes for the better.
But that might not be the only thing at play.
According to John Malloy, there’s something that has been shown to make a difference in student achievement in many places around the globe. It’s called academic optimism, and where it exists in schools — even when there are socioeconomic challenges — “students learn better.”
It’s fair to say Malloy, director of education for Hamilton’s public school board, is an expert on the topic. All his doctoral work was in this area.
“I’m going to try not to bore you,” he teases as he explains the concept.
Malloy says academic optimism is a term coined by researchers in Columbus, Ohio, his home state. It involves three things.
The first is high expectations for achievement. The second is teachers who believe they have the skill necessary to make a difference for students — or, if they do need help, colleagues who provide it. And the third is an enormous level of trust within the school community — among staff members, students and teachers, and between educators and parents.
“Three things,” Malloy says. “High expectations, a real sense of efficacy … and trust. And where those three qualities exist in schools — no matter what their cultural circumstances, no matter what their socioeconomic circumstances — the research would suggest that student learning improves.”
The idea sounds familiar.
That’s because it’s a lot like what Kelly Charles, the Adelaide Hoodless principal, has been working so hard to create in her school.
But why the effort?
There was a saying Charles heard at conference once that best sums it up.
“If we don’t get our students coming out the front doors of our school, they will be coming through the back doors of our society,” she says.
“These children deserve the best future we can give them, and to me, anything less is sacrificing that.”

John Malloy, Director of education, HWDSB

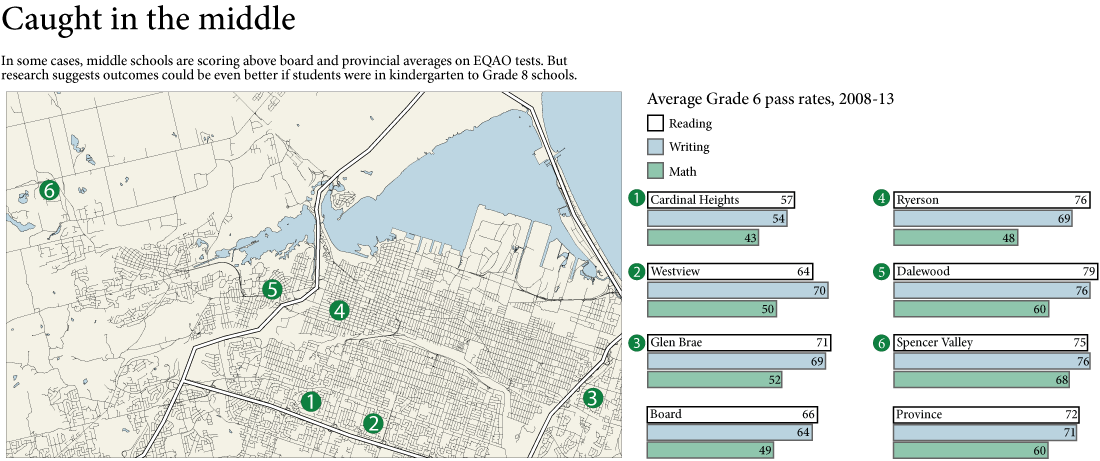
Weighing the worth of middle schools
Research has shown that attending middle school can have a negative effect on student achievement.
Yet some schools in Hamilton appear to be bucking that trend.
In the last six years, at least four of the city’s six middle schools routinely scored above the board average on EQAO tests, while two — Dalewood and Spencer Valley — frequently beat the provincial mark.
They’re also outperforming others like them.
According to a 2012 study by Wilfrid Laurier University economist David Johnson, two of Hamilton’s middle schools — Glen Brae and Westview — scored better than at least 80 per cent of other middle schools with similar demographics on EQAO tests, while just one of the six, Cardinal Heights, had a pass rate lower than predicted.
Yet there’s a problem. It’s possible students would be doing even better in a traditional school.
“We don’t know what these kids would be doing otherwise,” says Elizabeth Dhuey, a University of Toronto economics professor with expertise in the subject. “We only see them in middle schools.”
This information comes at a key time for public school trustees, who are reviewing the future of all but a handful of the city’s elementary schools over the next several years — middle schools included. The so-called accommodation reviews will provide board members with an opportunity to close middle schools or revamp them to take in students from kindergarten to Grade 8.
“I don’t think grade configuration and school configuration is going to be the be-all and end-all of school reform,” Dhuey says. “But if people are reorganizing, I think it’s a really good thing to think about.”
Hamilton-Wentworth District School Board chair Jessica Brennan says trustees will be grappling with the issue in any upcoming reviews. She also says that wherever it’s practical, trustees are committed to moving to a more traditional kindergarten to Grade 8 model.
Some educators, however, worry the approach overlooks important benefits.
Lourie Van der Zyden, a Grade 6 teacher at Cardinal Heights, says her kids went to middle school in Ancaster and it prepared them for high school. It also made them more responsible and independent.
“They thought it was a great idea,” she says, “and a lot of our students say the same thing.”
Teri Pecoskie
The Hamilton Spectator
Want to know how you would do on EQAO? Try our interactive test.
Grade 6 Writing
How we did it
Last fall, The Spectator obtained six years of standardized test results from Ontario’s Education Quality and Accountability Office. That information included the percentage of students who met the provincial standard in reading, writing and math at each of Hamilton’s 143 Catholic and public elementary schools between 2008 and 2013. On top of that, the data was broken down by grade level and gender — that is, the percentage of boys and girls that met the Ontario standard on any given test.
The Spectator then cross-referenced the results with socioeconomic information obtained from the Ministry of Education. The school-level data was calculated using information from Statistics Canada’s 2006 census, the Ontario School Information System, which tracks student population characteristics, and postal codes collected by individual schools.
For the purposes of this investigation, The Spectator analyzed results at those schools for which all data was available. The EQAO omitted data in cases where there were fewer than 15 test takers — or, in the case of the 2012-13 results, fewer than 10 — in order to protect against the potential disclosure of students’ personal information. The office recently changed its omission rules to align with ministry standards for data suppression.