Day 2
Why the difference?
Story by Teri Pecoskie

Teri Pecoskie is an award-winning multimedia journalist and The Spectator's education reporter. She also co-authored the landmark BORN: A Code Red Project series, which was awarded the country's highest investigative journalism honour in 2012.
Teri has covered issues related to school achievement since she started at The Spectator in 2010.
Photographs by John Rennison
Web design by Pete Smaluck
Published April 14, 2014.
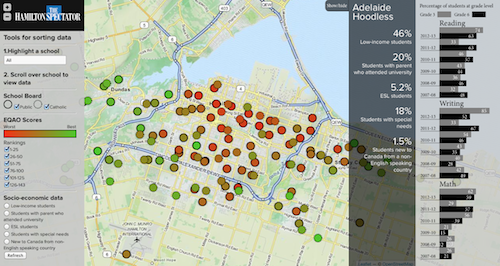
Interactive map: Find your school's scores
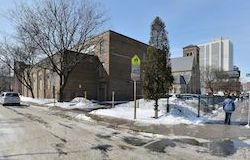
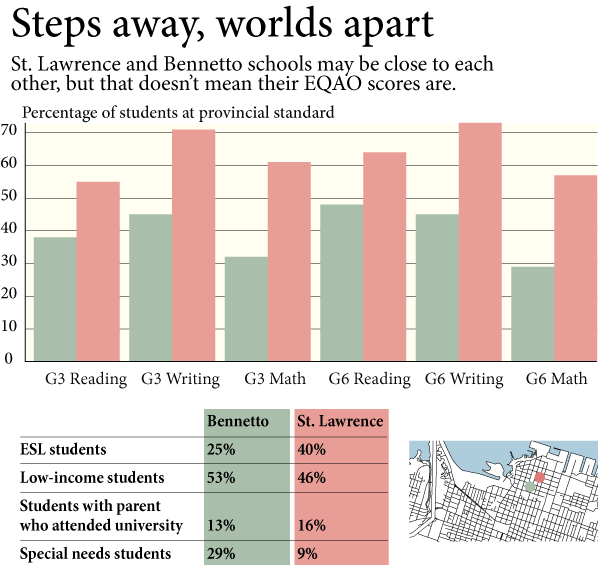
From the St. Lawrence parking lot, you could hit Bennetto with a stone. The two schools sit on either side of John Street – a few blocks north of the tracks, a few south of harbour.
They draw students from the same neighbourhood. They teach the same curriculum. They receive roughly the same funding from the province for each and every child.
But there a couple of things that set St. Lawrence and Bennetto apart.
One is a Catholic school, for instance. And it’s scoring significantly higher than the other on Ontario’s standardized EQAO tests.
The trend isn’t isolated, as this Spectator analysis of EQAO scores at more than 140 local elementary schools shows.
From one end of Hamilton to the other, Catholic schools are achieving higher pass rates on standardized tests than nearby public schools, despite being part of a single, publicly funded provincial education system designed to level the playing field for all kids.
And it’s happening at the board level as well.
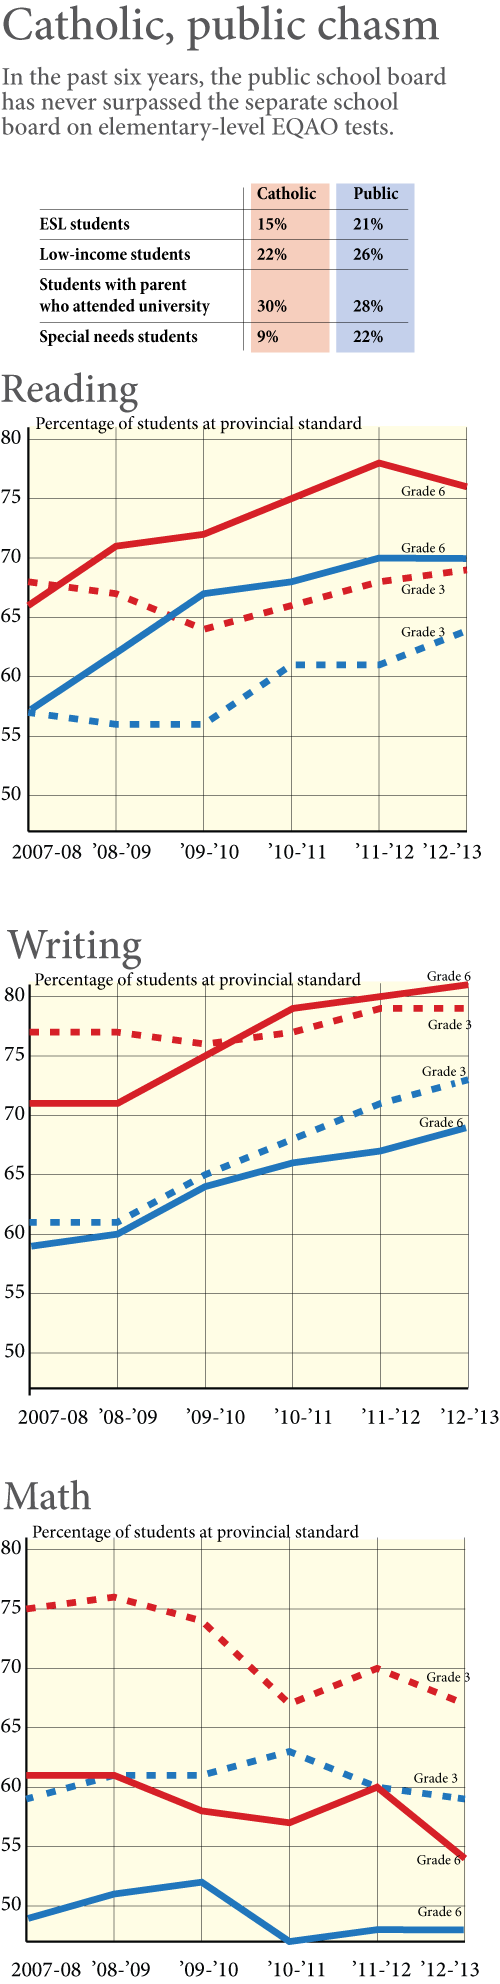
Since 2008, the Hamilton-Wentworth District School Board has never surpassed the separate board on elementary-level EQAO tests. Not at any grade level, or in any subject area.
The same is true for boards in Halton and Niagara.
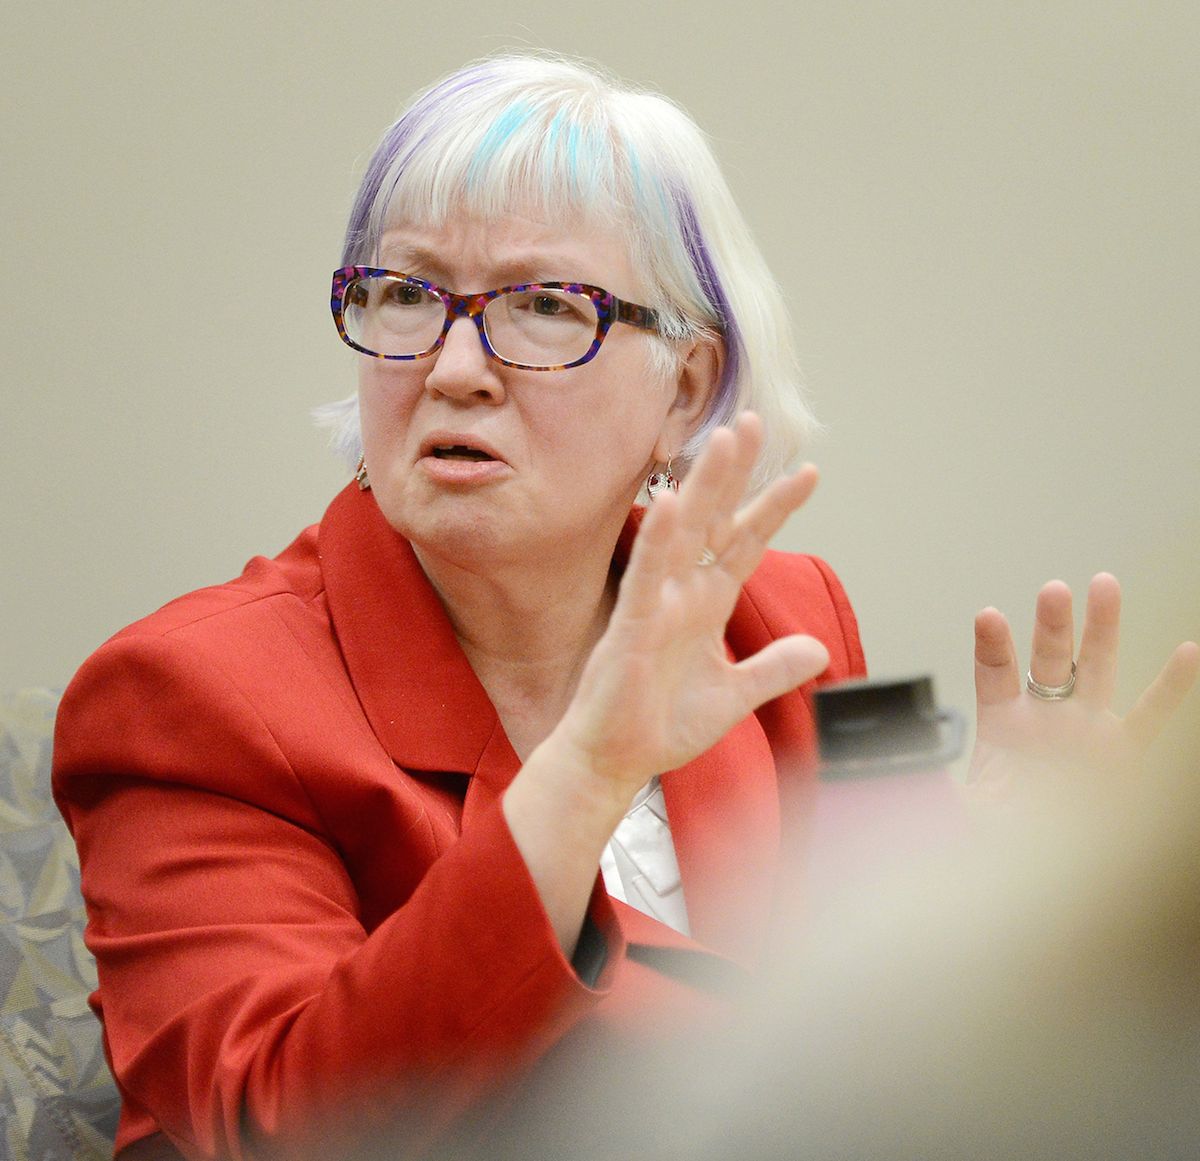
“It’s not uncommon to see that the kids in the Catholic schools are performing better,” says Abigail Payne, a McMaster University economist who studies the subject. “Now, apart from the religion course, they’re using the same curriculum … so what’s different?”
According to the experts, it could be several things. Social and economic factors can make a difference when it comes to outcomes. Parenting and teaching styles can too.
Or, as Payne suggests, it could be that Catholic schools are doing better on EQAO tests because it’s in their interest to.
Consider the following analogy:
“If I’m a gas station on the corner and I’m the only one in the area, I can charge whatever because you have no choice,” Payne explains. But when a second one opens up, you have to give customers an incentive, such as a lower price, to fill up at your station rather than your neighbour’s.
“It’s the basic notion of competition,” she says. “It’s really that concept with the schools.”
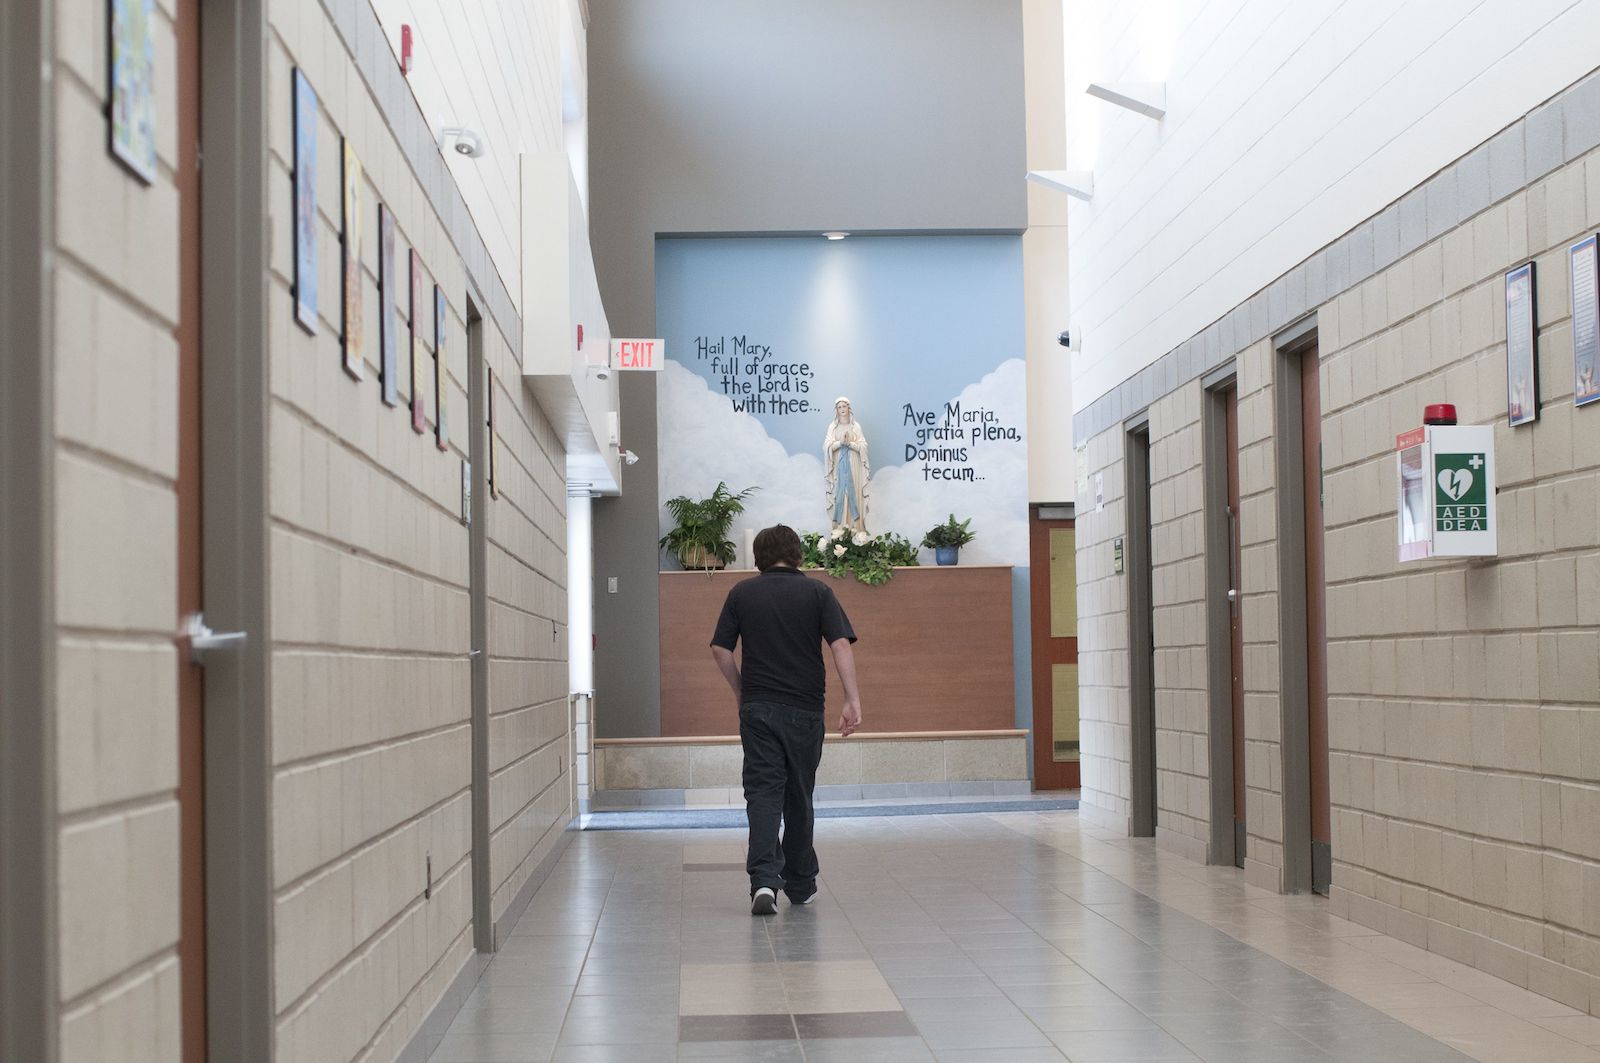
A statue of Mary holds a place of prominence in the hallway at St. Lawrence school in Hamilton's North End. The school fares significantly better on EQAO tests than its public school neighbour.
There are stark social and economic differences between Hamilton’s school systems.
The public board has about 20 per cent more low-income students than the Catholic board, for instance – a factor known to be connected to achievement. It also has about 40 per cent more students who speak English as a second language and 2½ times the percentage of students with special needs.
Since they serve different student populations, the public schools would be expected to score somewhat worse, says Washington-based urban strategist David Rusk.
But socioeconomics is just part of the explanation.
Even though the Catholic board has fewer low-income kids than the public board, it has more than the Ontario average.
And it still consistently scores above the provincial norm on several areas of the EQAO tests.
It’s happening at other Catholic boards as well.
A 2008 C.D. Howe study by Wilfrid Laurier University’s David Johnson found that of the 13 school boards in Ontario with above-average student achievement, 11 were Catholic. Of the 10 below-average boards, two were.
For Johnson, above-average boards were those that scored better than predicted on EQAO tests, when outcomes were adjusted for family income and other factors. Below-average boards were those that scored worse.
Rusk, the consultant, knows social and economic circumstances have a significant part in local test outcomes.
However, the gap between Hamilton Catholic and public boards could also be influenced by something else:
Choice.
“Choosing to go to Catholic rather than public school does suggest that a parental decision is involved,” he explains. And having a more engaged parent “is an important factor in a child’s academic success.”
Jim Dunn is blunt when asked why he thinks Catholic schools score higher than public schools on EQAO tests.
“Which of putting your kid in Catholic school or putting your kid in public school is comparable to falling off a log?” says the McMaster University urban health professor. “The path of least resistance is, by far, the public school.”
What Dunn means is that the public system is the default option. It’s simple for any child to enrol.
It’s not the same when it comes to separate schools.
Say you’re not Catholic, says Dunn. You have to go through an application process and an interview if you want your kids to attend a separate school.
Even if you are Catholic, as is the case with some 85 per cent of the kids in the system, you have to prove it – “so there’s a barrier.”
“The people who are least likely to verify their Catholicness or don’t think about the implications of one school board versus another – that’s going to have a socioeconomic distribution with it,” Dunn says.
“Skills, wherewithal, awareness, motivation, ability to navigate the system – all of those things not only correlate with the likelihood that you’re going to put your child in a Catholic school if it’s an option, they also strongly correlate with parenting.”
Annie Kidder understands his point. As executive director of the research and advocacy group People for Education, she’s diligently studied the relationship between parenting and academic success.
The literature is clear that high expectations make a difference, she says. So if you expect your kids to succeed, you’re going to talk to them about school and ensure they have good work habits.
You’re also going to care about who’s teaching them, and where.
“For those families that make a conscious choice, their children tend to do better,” says Kidder. “It’s like there’s an attitude right from the very beginning – I care about school enough or I care about my religion or whatever it is enough that I’m making a conscious choice to send you to this school.”
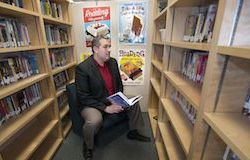
Susanne Caetano didn’t think twice about sending her kids to St. Lawrence, the North-End school.
It’s just a few blocks from her home, for starters, and it’s the same school she attended growing up.
“I know the school and I had good memories of it,” she says. “So I was happy my kids were going there, too.”
But history was only part of the reason she chose a Catholic school over a public one. It was also a matter of faith.
“I’m a practising Catholic,” she says. “I teach my kids these values and I know the school does, too.”
Elementary schools by the numbers
| Catholic | Public | |
|---|---|---|
| Students | 18,654 | 30,963 |
| Schools | 48 | 95 |
| Classroom teachers | 825 | 2,097 |
| Resource teachers | 266 | 135 |
| Early childhood educators | 101 | 180 |
| Educational assistants | 527 | 473 |
| Average class size 1 to 3 | 17.7 | 19.5 |
| Average class size 4 to 8 | 23.8 | 25.1 |
| Budget | $336,186,880 | $588,236,703 |
AUDIO: The Spectator asked provincial union officials what they think is behind the gap between Catholic and public schools. Here's what they had to say:
James Ryan, president of the Ontario English Catholic Teachers Association
Susan Swackhammer, 1st vice-president of the Elementary Teachers' Federation of Ontario
The only thing that separates Blessed Kateri Tekakwitha from Cecil B. Stirling is a two-minute walk down Queensbury Drive – that, and the east Mountain schools’ EQAO scores.
On average, Blessed Kateri outscored Stirling by 40 percentage points on standardized tests in reading, writing and math over the last six years, in spite of having roughly the same proportions of non-English speakers and low-income kids.
Now take 10 pairs of schools like these, none separated by more than a few blocks.
Since 2008, the Catholic schools have outpaced the public schools on Grade 3 tests in every single pairing. On the Grade 6 tests, the Catholic schools had higher average pass rates 80 per cent of the time.
Blessed Kateri Tekakwitha and Cecil B. Stirling are a two minute walk from one another on the East mountain.
These neighbouring Catholic and public schools have had very different success rates on EQAO tests. Scroll over the map to see how they stack up.
The numbers represent percentage of students at the provincial standard, on average, from 2008-2013.